Evaluating Performance
cpuinfo
As discussed in lecture, the SIMD/vector instruction sets for Intel architectures have been evolving over time. Although modern compilers can generate machine code for any of these architectures, the chip that a program is running on must support the instructions generated by the compiler. If the CPU fetches an instruction that it cannot execute, it will throw an illegal instruction error.
The machine instruction cpuid can be used to query the microprocessor about its capabilities (see:
CPUID). How to issue these queries and how to interpret the results is explained (e.g.) in the linked wikipedia entry for cpuid. A small program for querying your machines CPU in this way is provided in cpuinfo.cpp. The program interacts directly with the CPU using assembly language instructions (in particular the cpuid instruction).
Compile and run cpuinfo (there is a rule for it in your CMakeLists.txt file).
$ ./build/cpuinfo
For Macbook having Apple M1 chip, unfortunately, cpuinfo583.cpp does not work on M1 chip machine, as it uses a completely different architecture as well as instruction set. You will have to try on another machine that does not use Apple M1 chip. Or you can team up with one of your classmates whose laptop is not using Apple M1 chip. Remember to credit your classmate.
You will get a listing that shows a selection of available capabilities on your own machine. Run this command and check the output. The particular macros to look for are anything with “SSE”, “AVX”, “AVX2”, or “AVX512”. These support 128-, 256-, 256-, and 512-bit operands, respectively.
Answer the following questions in
results/answers.md:
- What level of SIMD/vector support does the CPU your computer provide?
- What is the maximum operand size that your computer will support?
- What is the minimum operand size that your computer will support?
- What is the clock speed of your CPU? You may need to look this up via “About this Mac” on MacOSX If your Macbook is using Apple M1 Chip, try “sudo powermetrics” in the terminal, looking for “CPU frequency”. Look at the “Performance” Tab in Task Manager on a Windows; and try “lscpu” in the terminal on a Linux.
Roofline Model
We presented the roofline model during our lectures, which provides an upper bound to computational performance, taking into account both potential floating point performance as well as the ability of the system to supply enough operands to the CPU to do its computations (bandwidth). A roofline model can be plotted on a graph of performance (in GFlop/s) as a function of “numerical intensity” (Flops/byte). The limitations on computational performance (in GFlop/s) are horizontal lines on the graph, while bandwidth (bytes/sec) is a sloped line. For example (measured on my laptop):
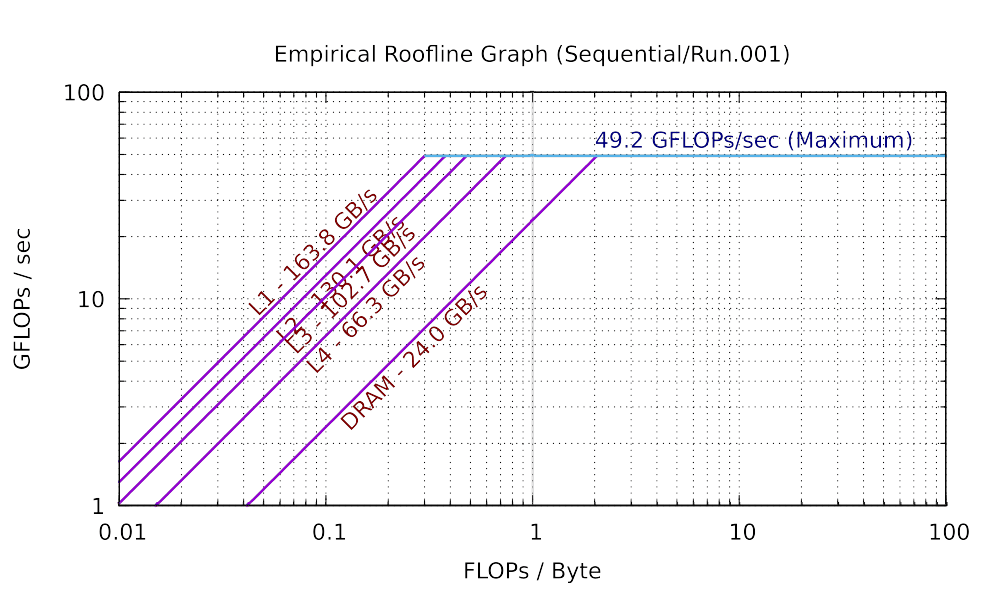
As we have also discussed, your computer doesn’t have a single bandwidth. The bandwidth between L1 cache and the CPU is significantly larger than the bandwidth between main memory and the CPU. The performance of your program therefore depends also on the problem size as well as the numerical intensity.
For this part of this assignment I want you to continue developing an intuition for what affects (and effects) performance on your computer (or any computer). There isn’t a “right answer” for this part. Every computer system is different – and, as we have seen, trying to suss out different aspects of your computer’s performance is complicated – made even more so by the compiler (which are subtle and quick to anger).
But what I want you to for this part is to create a roofline model for your computer – again, there isn’t a right answer.
For the roofline model you will need to characterize a few things. First is the peak available performance for your computer (for now we will just be looking at peak performance available with a single core). The second is the bandwidth – for L1, L2 (if present), L3 (if present), L4 (if present), and main memory (DRAM).
Below are some experiments to do to help determine these parameters for your computer.
Assessing your Computer’s Bandwidth
Our starter repository has a subdirectory bandwidth that contains a set of tools that we will use for measuring the performance. When running, these tools will execute a profiling program that puts its results into that subdirectory. You run the tools by executing the following commands:
$ cd bandwidth
$ ./run.sh
On some platforms, you may have to explicitly mark the script
bandwidth/run.shas being executable to be able to run the benchmark. Please execute the following commands if you receive a ‘Permission denied’ error. This has to be done once only, not every time you open the VSCode project.$ cd bandwidth $ chmod +x run.sh bw.sh
The bandwidth program may run for quite some time – 10-20 minutes – during which time your computer should have as little load on it as possible (other than the bandwidth program itself).
When the program completes, there will be two files in the bandwidth directory – bandwidth.bmp and bandwidth.csv. The file bandwidth.bmp is an image of a graph showing data transfer rates for various types of operations. The file bandwidth.csv is the raw data that is plotted in bandwidth.bmp, as comma separated values. You can use that data to do your own investigations about your computer.
An example of bandwidth.bmp from my laptop is the following (your results will most likely vary):
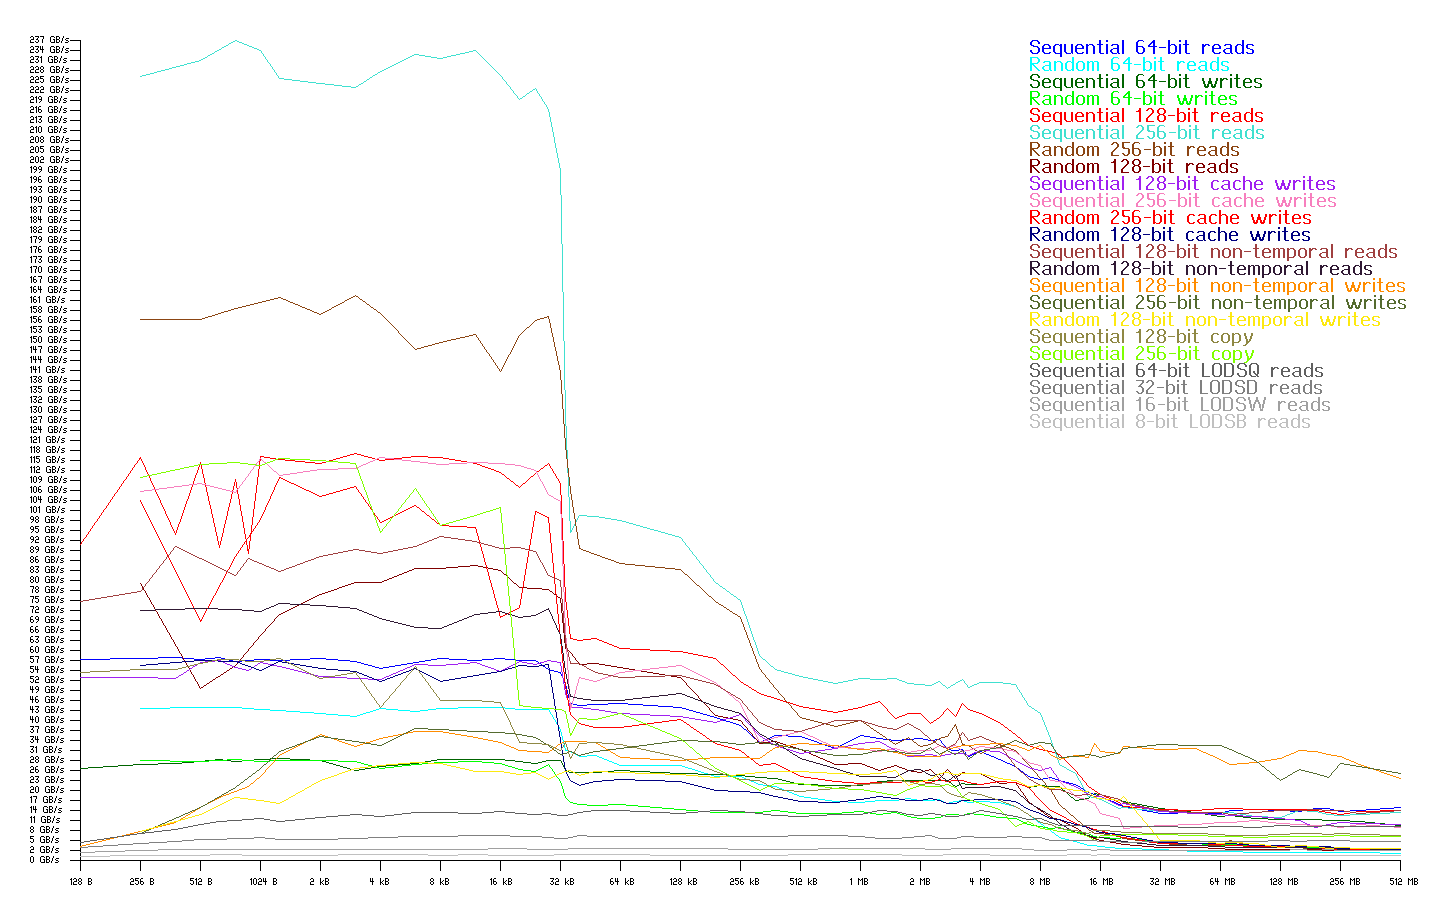
In looking at the bandwidth graph you can see one or more places where the transfer rate drops suddenly. For small amounts of data, the data can fit in cache closer to the CPU – and hence data transfer rates will be higher. The data transfer rates will fall off fairly quickly once that data no longer completely fits into cache.
Answer the following questions in
results/answers.md:
- Based on the output from running this image on your computer, what do you expect L1 cache and L2 cache (if present) sizes to be? What are the corresponding bandwidths? How do the cache sizes compare to what “about this mac” (or equivalent) tells you about your CPU? (There is no “right” answer for this question – but I do want you to do the experiment.)
- Add your
bandwidth.bmpandbandwidth.csvgenerated by the bandwidth tool to theresultsdirectory and submit those as part of your homework.
The bandwidth program attempts to determine what AVX features your CPU has and then attempts to use only those for doing its benchmarking. In some cases, we have found that it doesn’t quite get this right, and will attempt to issue instructions that the host CPU does not in fact support. In that case, your program may exit with an “Illegal Instruction” message. If that happens, please let us know, we have a possible workaround for this case in place. In this case, the tool may underestimate maximum available bandwidth, but you will still be able to see the difference between performance for different levels of cache.
Creating a Roofline Diagram for your Computer
A set of tools that will profile your computer and create a roofline plot has been put into the subdirectory ert in the starter repository. You run the tools by executing the following commands:
$ cd ert
$ ./run.sh
On some platforms, you may have to explicitly mark the script
ert/run.shas being executable to be able to run the benchmark. Please execute the following commands if you receive a ‘Permission denied’ error. This has to be done once only, not every time you open the VSCode project.$ cd ert $ chmod +x run.sh ert Scripts/*.py
When running, this image will put its results into a Sequential/Run.001. The roofline characterization will run for a few minutes, but probably not as long as the bandwidth characterization.
Once the tool finishes running, you will find results in the subdirectory named
Sequential, under which there will be one or more subdirectories with the name like Run.001. Directly in the Run.001 subdirectory will be a file roofline.pdf, which contains a graph of the roofline model for your computer.
If you do multiple runs of the roofline profiler, delete the subdirectory
Run.001each time so that the profiler has a fresh directory to write to and there won’t be old or incomplete results to confuse you or to confuse the profiler.
Answer the following questions in
results/answers.md:
- What is the maximum compute performance of your computer? (The horizontal line.) What are the L1, L2 (if present), and DRAM bandwidths? How do those bandwidths correspond to what was measured above?
- Add your
roofline.pdfgenerated by the ERT tool to theresultsdirectory and submit that as part of your homework.
Next up: Exercises